In this how-to I will show you how you can build your own GPS-powered tracking system in a few minutes. For this we use the following components:
- The free Android app Zanzito to send the GPS data to a message broker
- Eclipse Mosquitto as a message broker
- node-RED to connect mosquitto with open street map
- a sloppy.io Account to start the needed docker containers
Let’s start with deploying mosquitto in a new project. Click “Create a new project”, name the project something like “mygps” and the service “tracker”, then go to the settings of the first app by clicking “settings”:
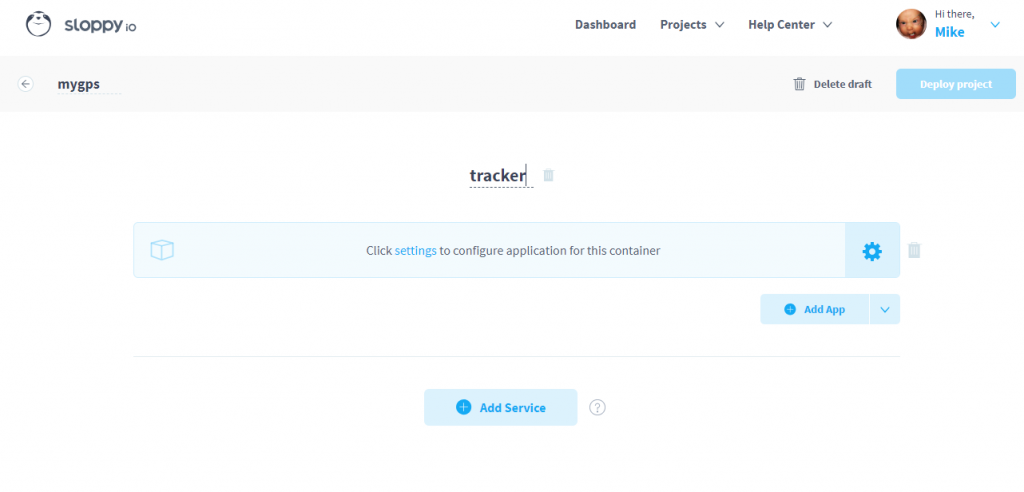
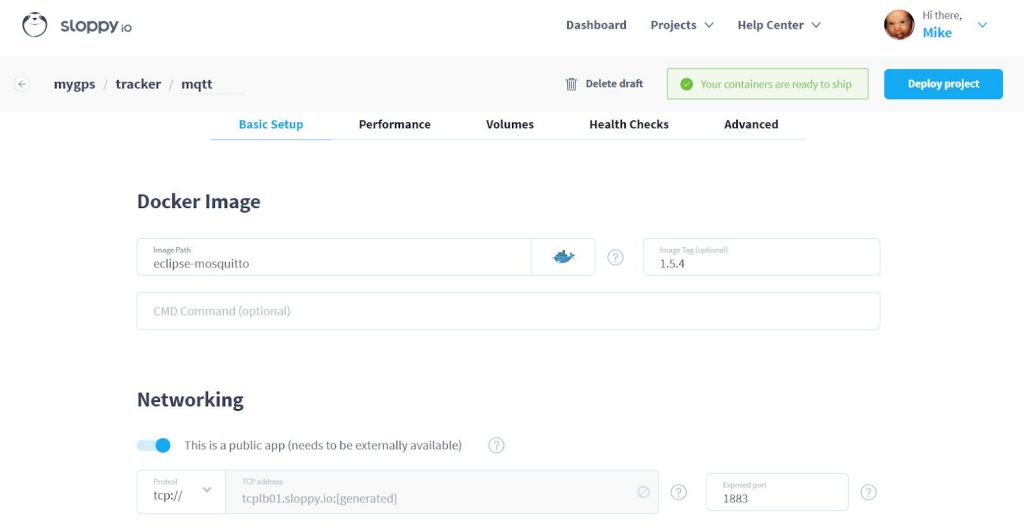
Now name the app “mqtt” for and choose the official eclipse-mosquitto image from Docker Hub. Because we don’t like surprises (the default ‘latest’ tag might break our app after a restart), we set the tag of the latest version, here 1.5.4. This makes sure that after a restart of the container the same version of the image is started.
Under Networking choose “tcp” as protocol, as mosquitto is a service which needs to receive it’s data via TCP. Set the port to 1883.
The two necessary volumes are configured automatically, so we can go aheadand click on “Deploy Project”.
- id: mqtt
- image: eclipse-mosquitto
- tag: 1.5.4
- protocol: tcp
- port: 1883
- volumes: /mosquitto/data, /mosquitto/log (should be automatically set)
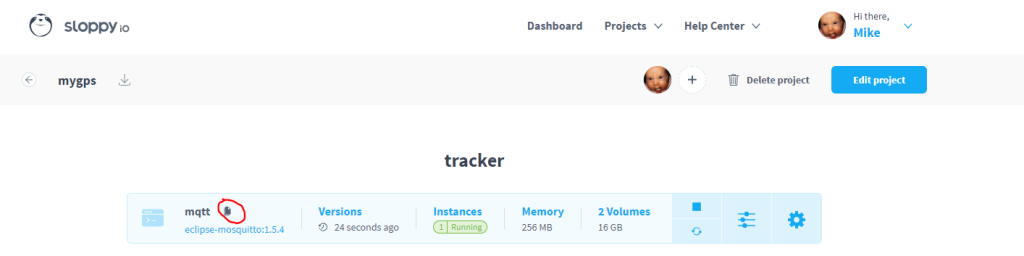
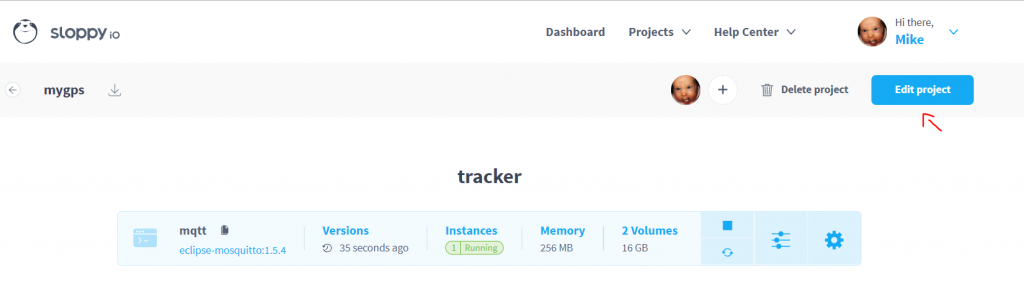
After a few seconds the mosquitto message broker is up and running. If not, check our article about debugging containers.
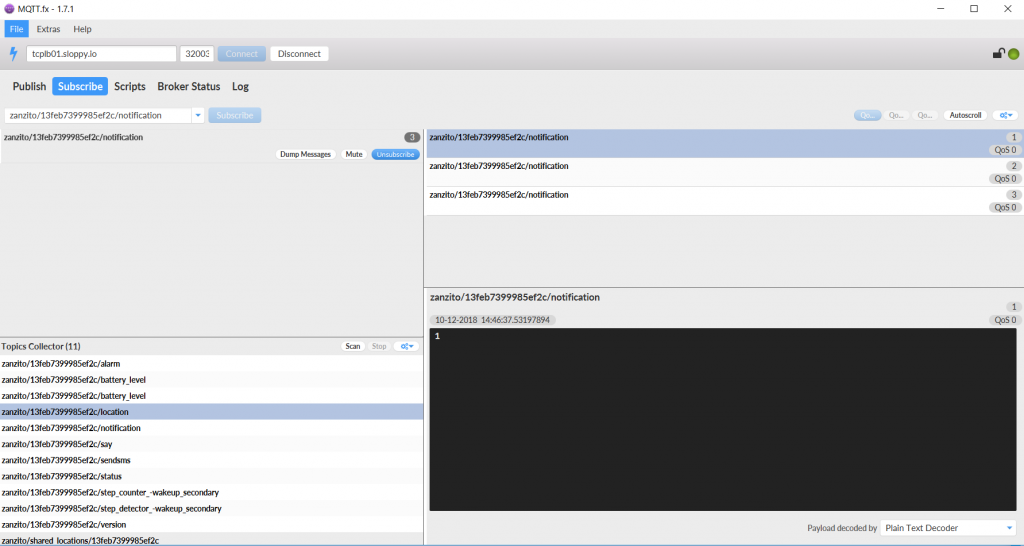
Let’s test if the broker is working by using an mqtt client. I used mqtt.fx for this. After installation of mqttfx insert the TCP connection as broker address and port. You can get this information by clicking the copy symbol from the sloppy.io Web UI.
Click Connect then choose the “Broker Status” tab and click “Subscribe”. This will pull some information of the mosquitto broker. You can also have a look on the Log tab to check if everything is fine, publish some data etc.
Sending sensor data from a smartphone
Our message broker is ready to receive data, but simple sample data is boring, so we will use some dynamic data from our smartphone. Zanzito is a powerful app for Android phones to send sensor data of your mobile to an mqtt broker.
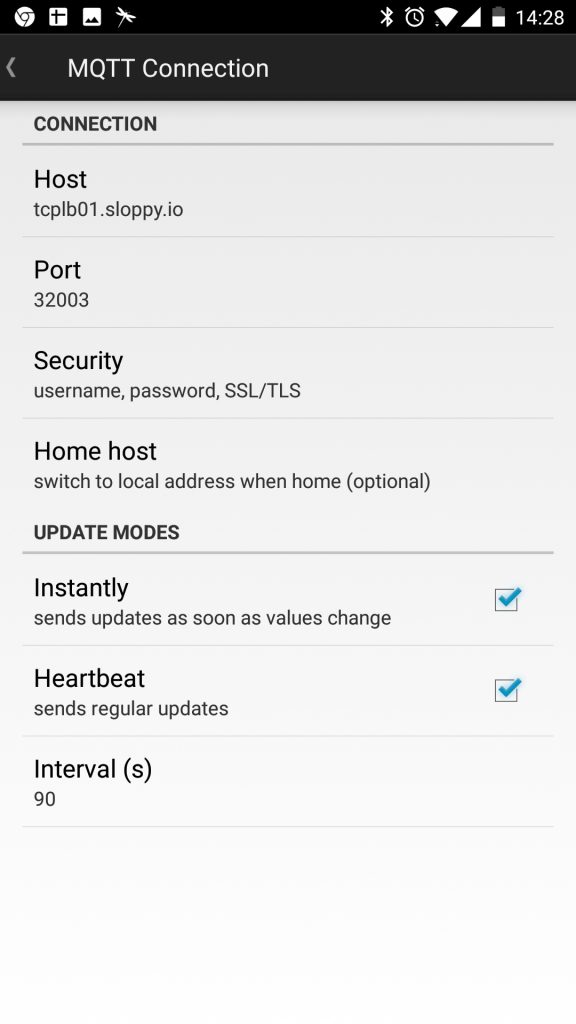
After installation check Preferences=>MQTT Connection and enter the information of our broker (Port will be different for your broker):
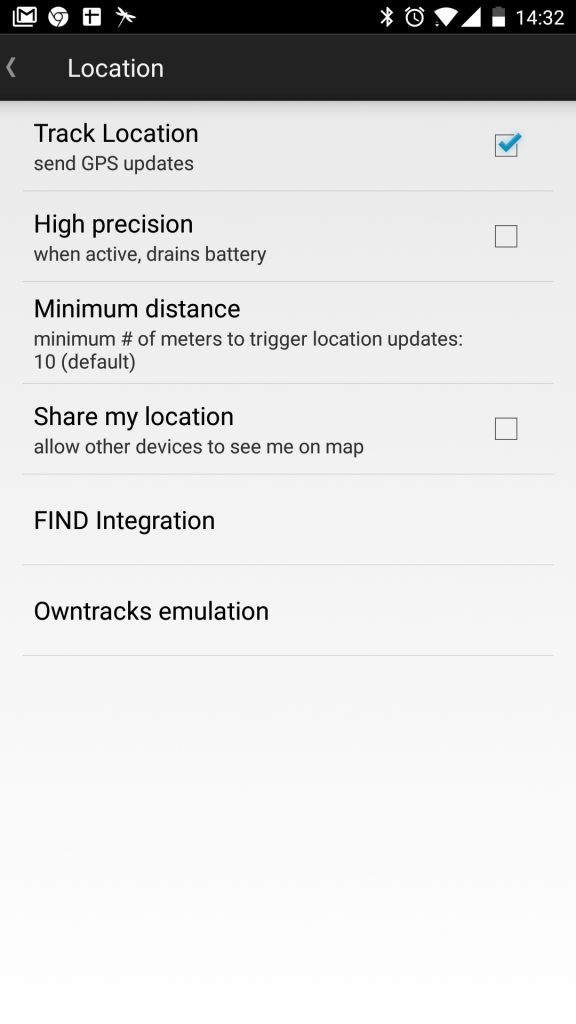
In Preferences=>Location enable “Track Location”. This makes Zanzito send the data to our mosquitto container:
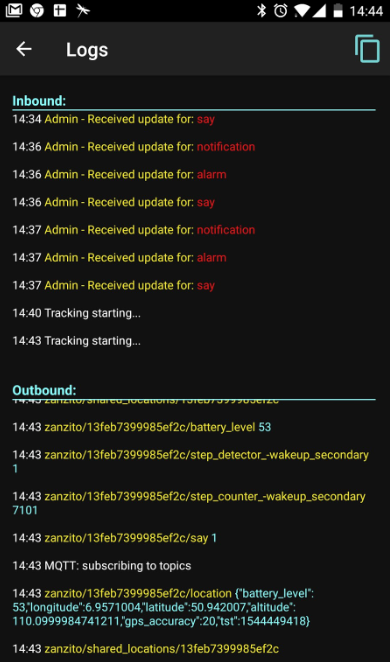
Under “View Logs” we can check what data is sent and the name of the topics:
In MQTT.fx under Subscribe, look for the “Topics Collector” section and click on “Scan”. Wait until the */location topic shows up and double click it to subscribe.
Rendering GPS data on a map
Now we need something to take the location data from Mosquitto and render it on a map. Enter node-RED, which is a graphical tool for wiring together hardware devices, APIs and online services. Of course there is an official docker image so let’s add it into our project by clicking “Edit project”.
Then “Add App” and go to “settings”, where we configure the node-RED container.
- id: nodered
- image: nodered/node-red-docker
- tag: 0.19.5
- protocol: https
- domain: a subdomain of *.sloppy.zone, like nodered.sloppy.zone
- port: 1880 (should be automatically set)
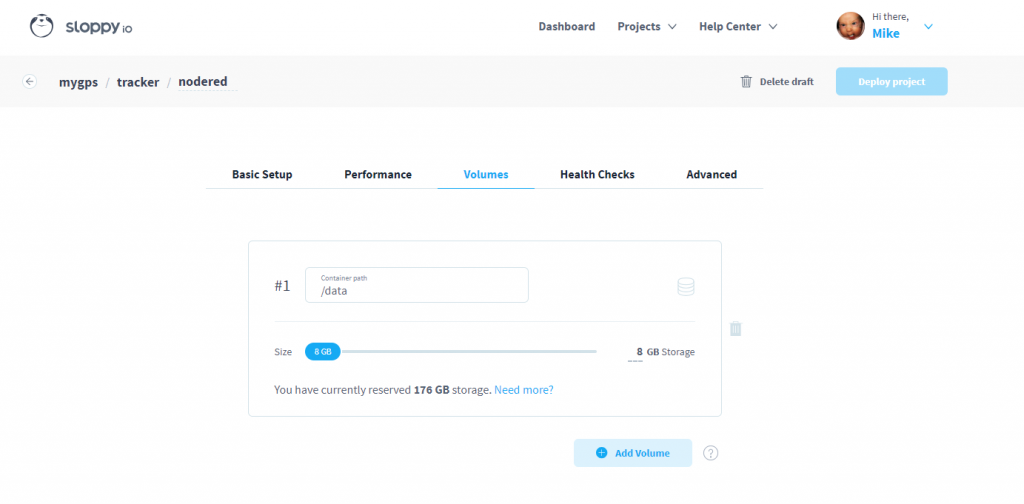
- volumes: /data
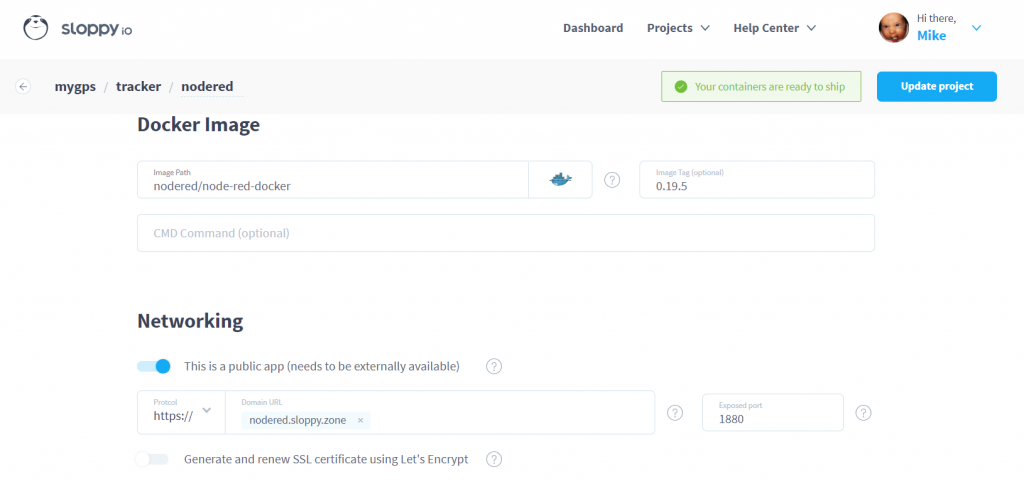
The dockerfile of node-RED does not define a volume, but we want our data to be persistent so we add the volume manually.
We are ready to ship and click “Update project”. Once node-RED is running, we can open the configured URL by clicking on “View”.
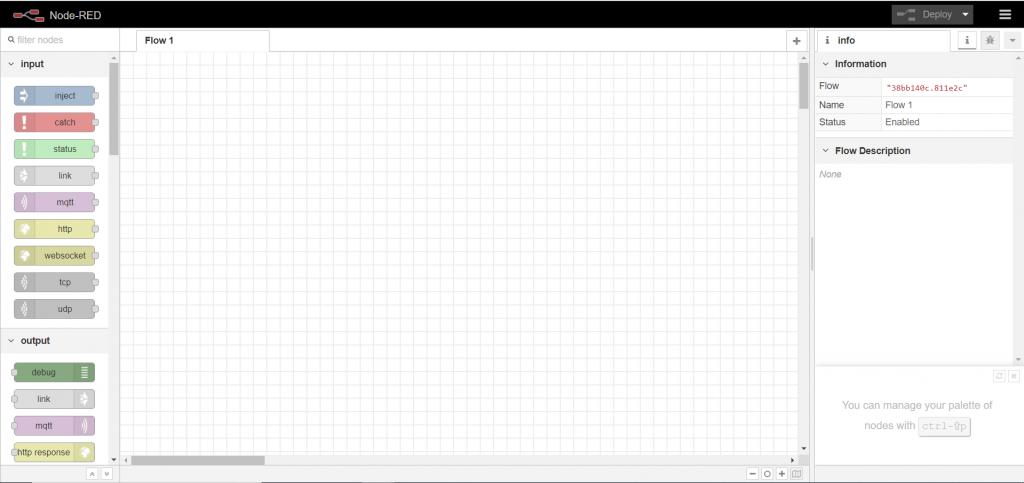
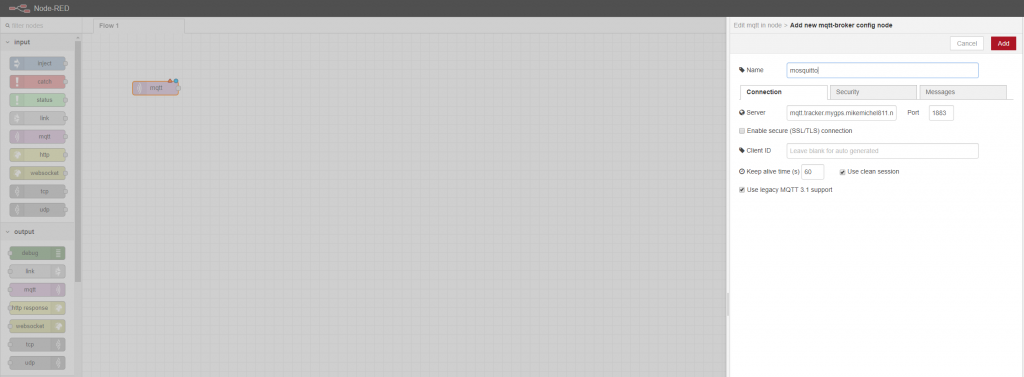
Next we choose the input node “mqtt” from the left side and drag+drop it to our flow (the empty area in the center). A double-click opens the settings of this node where we can enter the information of our mosquitto broker. Since both containers run on the same network, we can improve performance by using the the internal connection string of our mosquitto container. You can find it under Settings => Advanced, at “Connect other containers”.
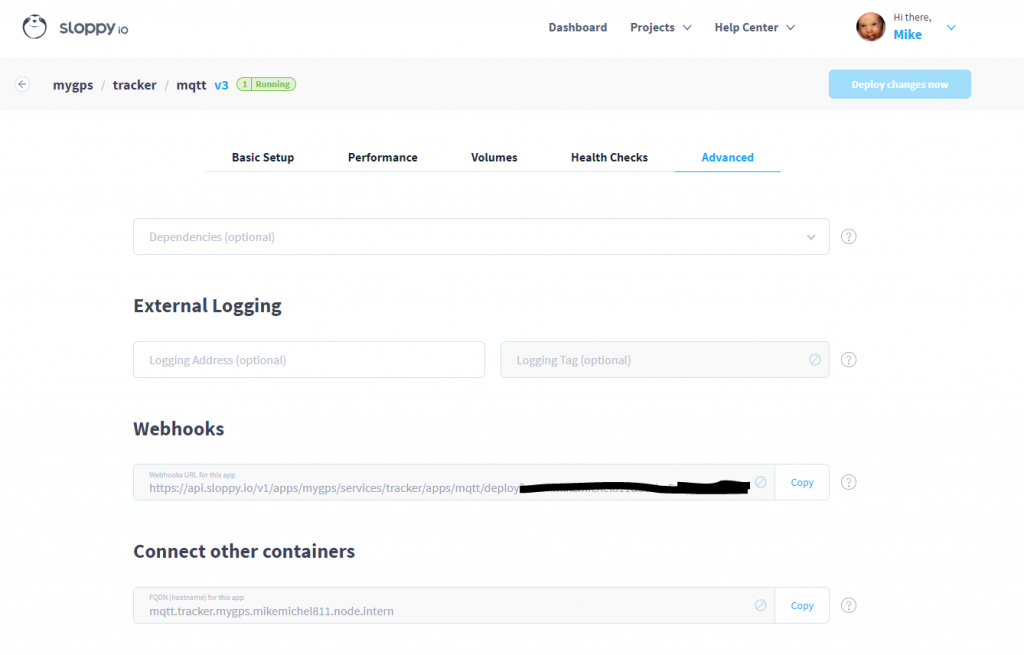
Insert this address, ending with “.node.intern” into node-RED as the mqtt server:
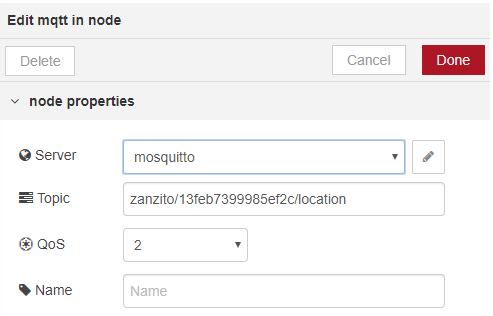
Click on “Add”, then add the topic the mqtt input node should subscribe to. This is the topic your created by Zanzito and sent to mqtt. For me it is “zanzito/13feb7399985ef2c/location”, but the id part will be different in your own setup. If you’re using MQTT.fx, look for the name of the topic under Subscribe => Topics Collector.
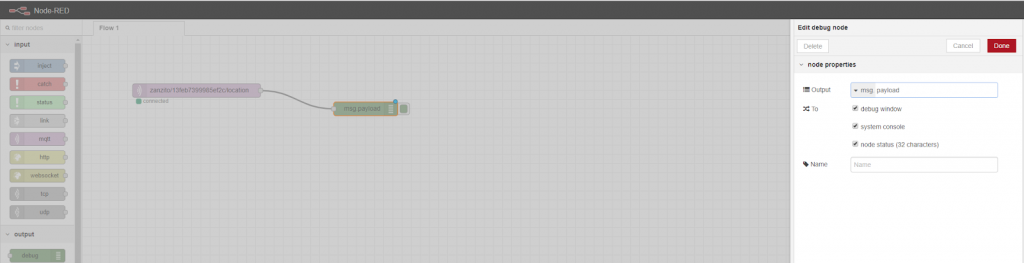
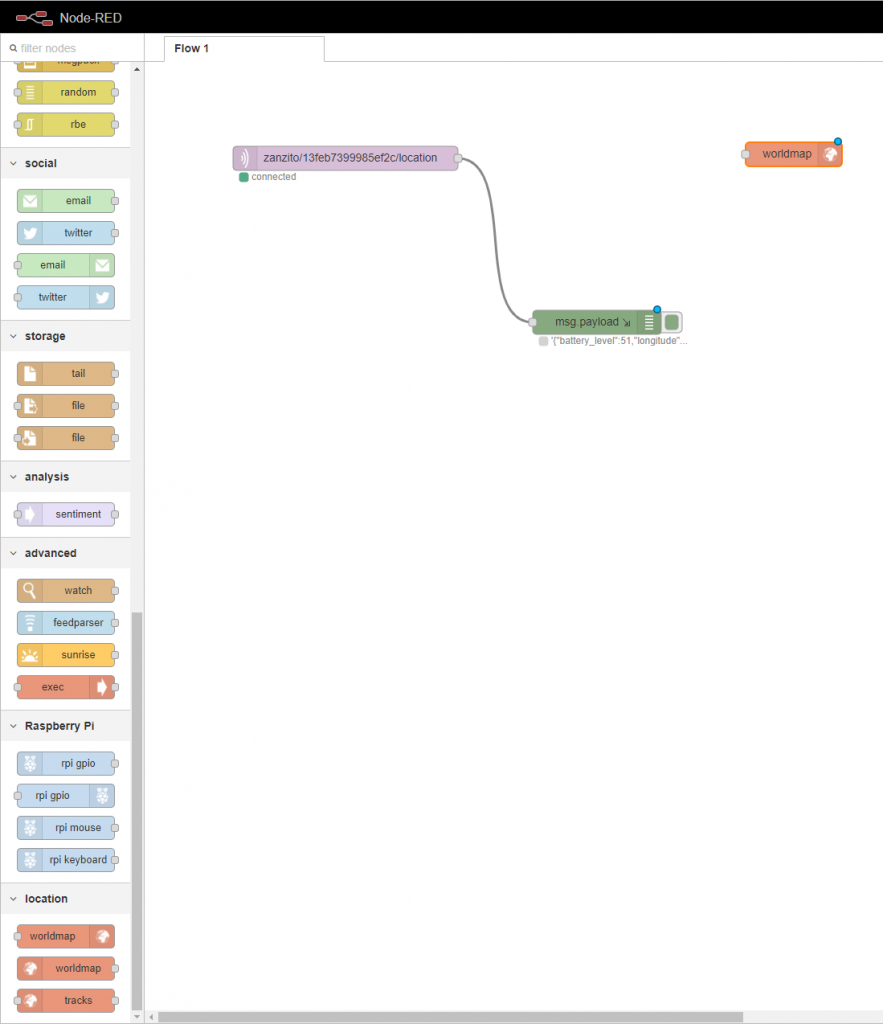
After clicking “Done”, we’ll add a debug output node for ..you know.. debugging, and connect it to the mqtt node, by dragging between the two connectors.
Ok, it is time for a first test. Click “Deploy” in the upper right and wait a few seconds.
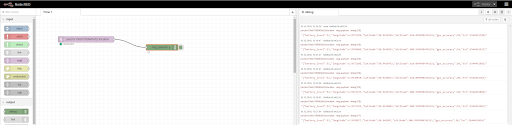
In the debug pane (click the little bug icon on the top right) you will see the data which is received by mqtt and forwarded to the debug node. Of course we want to do something useful with it. A map would make sense, right?
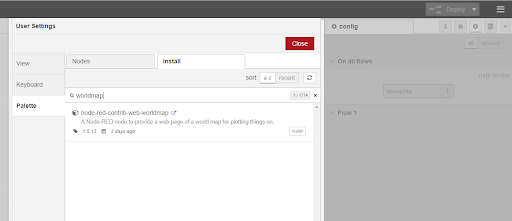
Lucky for us there is an installable node for this called worldmap. Open the menu in the upper right (the ‘hamburger’ icon), then “Manage Palette” => Install and search for “worldmap”.
After the installation it will appear on the left, at the bottom of the nodes pane, and you can drag+drop it to the flow.
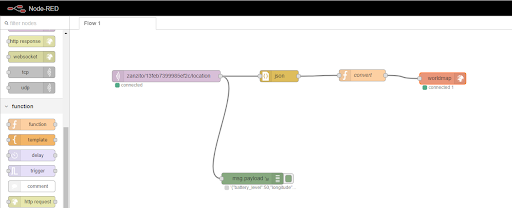
If you check the “Usage” part of the worldmap node you will notice that this node expects a payload like { name:"Jason", lat:51.05, lon:-1.35 }, but we have {"longitude":6.9570905, "latitude":50.9419852, "altitude":100.5999984741211, "gps_accuracy":19, "tst":1544451527}, so we need to change this somehow. This is a job for node-RED functions. We take a “json” and a “function” node and connect them.
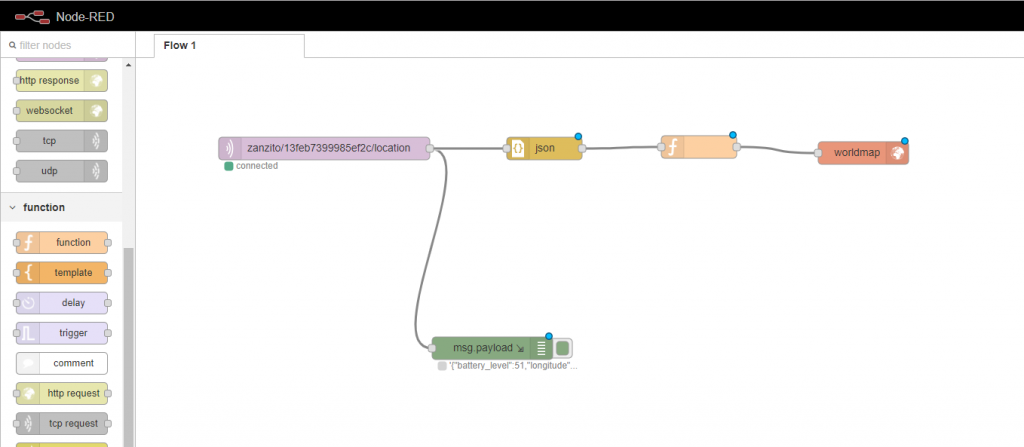
The JSON function converts the string received from mosquitto to an object, and in the function node we can transform the object to the payload the worldmap node is expecting. Let’s double-click on it to open the function editor.

We name the function “convert” and add a few lines of JavaScript to convert the incoming payload:
return {
  payload: {
    lon: msg.payload.longitude,
    lat: msg.payload.latitude,
    name: "Mike",
    popped: true
  }
};
popped: true opens the marker popup on the map, using the name and coordinates. Check the worldmaps node usage instructions for more options.
Deploy the flow once more, then wait a few seconds for new data arriving from your client.
Check your map by opening https://your-nodered-domain.sloppy.zone/worldmap/ (the link is also shown at the end of the info pane when the worldmap is focused) and move to your location.

From here you have endless possibilities, like enabling the step count sensor in Zanzito or using the InfluxDB output to save your data into a time series database. I have to say it is really fun to play with node-RED.
A word about security: You should not let your node-RED instance unprotected in the open internet. Use our basic auth feature to protect it or check the node-RED docs.
Don’t have a sloppy.io account yet? Sign up now, it’s free.